Side Green and the Tart Cherry Development and Production Tool
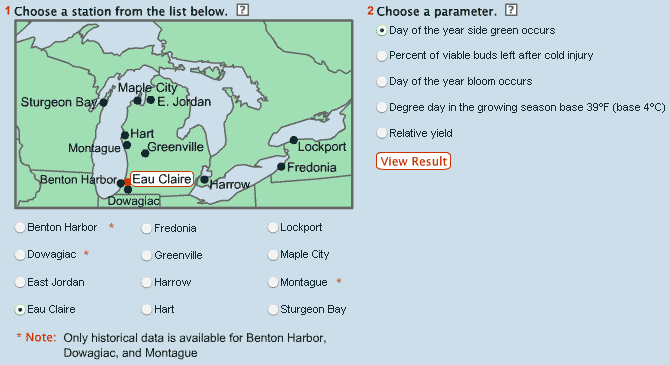
Phenological (link to explanation) and yield models have been developed specifically for the Pileus Project and are available for use through the tools. The Tart Cherry Development and Production Tool can display trends for the “day of the year side green occurs at a given location for approximately the last 40 years. Go to the tool and select the station that you would like to view. In our example, we will select Eau Claire for the first step and “Day of the year side green occurs” for the second step.
The results can be seen below. The blue dots represent the actual day of the year that side green occurred and the red line indicates the moving average (link to explanation). You can see that in this example, there appears to be a downward trend, indicating that side green is occurring earlier in the year than in past years according to the simulation model.
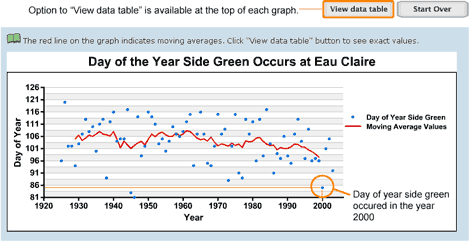
In this example, in the year 2000, the model shows that the day of year side green occurred was approximately 85. What does this mean? While the Y axis labeled “Day of the Year” represents the Julian Day beginning with January 1st, the actual calendar day can be viewed when you click on the "View Data Table" button.
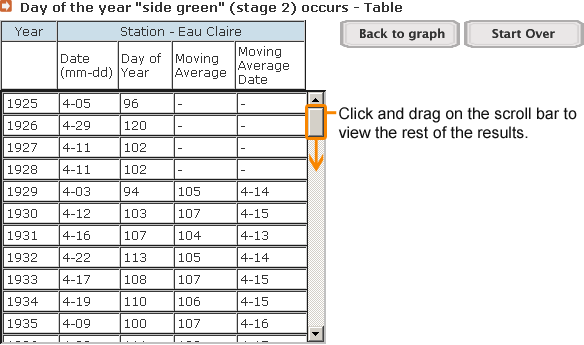
The table list units both in Julian Day and in in calendar day. All columns in the table that include the word "Date" are measured in calendar days. In our example, to view results for years after 1935, click and drag on the scroll bar.