Monthly Mean Temperatures over the Last Century
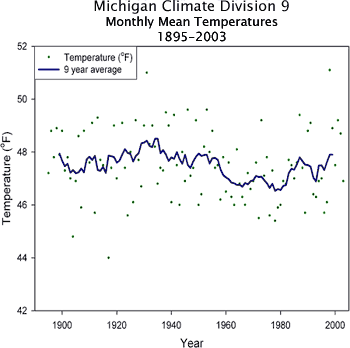
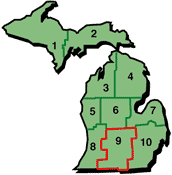
On the right is a graph of average annual temperatures since 1895 in Climate Division 9 (see map below) covering sections of South-Central Lower Michigan, which is representative of temperature trends across the region. The trends are generally similar to those on the global scale, with a warming trend from about 1900 through the late 1930s followed by a cooling trend through the late 1970s, followed by another warming trend which continues through the present. While mean temperatures in Michigan have increased during the last 20-30 years, they still remain within the range of observations during the past 120 years.
NEXT TOPIC: Notable Trend in Mean Winter Minimum Temperatures. ![]()
RETURN TO: Historical Climate Trends ![]()