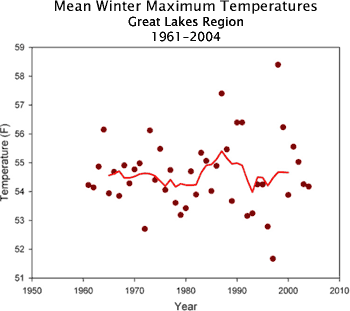
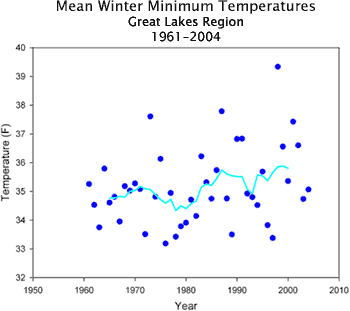
Mean Winter Maximum and Minimum Temperatures in the Great Lakes region
Below are two graphs for the Great Lakes region depicting average annual maximum and average annual minimum temperatures. While average maximum temperatures have changed relatively little (indicated by the graph on the left), minimum temperatures have increased since about 1980 and account for the majority of the overall temperature increase since then. This trend appears across all seasons but is most pronounced during the winter. In general while, mean temperatures in Michigan have increased during the last 20-30 years, they still remain just within the overall (upper) range of observations during the past 120 years.
PREVIOUS TOPIC: Notable Trend in Mean Winter Minimum Temperatures 
RETURN TO: Historical Climate Trends ![]()