Historical Weather Tool User Case 3 (Page 2)
Tart cherry growers look at the historical temperatures over the last five years.
In the previous example, we looked at the historical records for the minimum and maximum temperatures for 2002, which was a year where there was a significant crop loss due to spring freeze. In this example, the tart cherry growers in Northwestern Michigan would also like to look at the temperatures over the last five years (2000-2005).
In this case, the Historical Weather Tool would be useful.
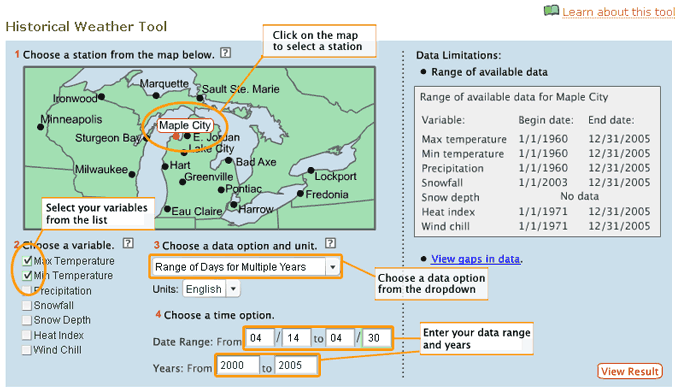
- They can check the minimum and maximum temperature historical records by clicking "Maple City " on the map and selecting "Range of Days for Multiple Years", for the dates April 14 through April 30. For the Years, they would enter 2000 for the starting year and 2005 for the end year.

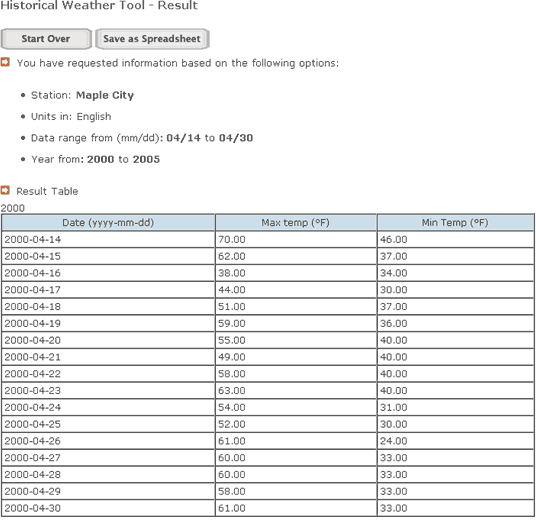
- The output shows the historical temperatures recorded for the dates April 10 through April 28 for each year, beginning 2000 through 2005.


The ouput in this example shows the maximum and minimum temperature for the requested range of days (April 14 through April 30) for the years 2000 through 2005. Each range of days is separated into its own table.
PREVIOUS PAGE: How can the tart cherry growers view temperature for the month of April in 2002?![]()
Go back to the historical weather tool usercases list![]()
