SkiTool Usercases
What are Probability Forecasts and What Do They Mean? - slide 2
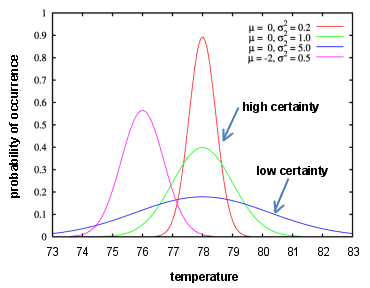
The degree of certainty can be expressed graphically in the form of a probability curve. Typically the degree of uncertainty is the same on either side of the expected value. Normally distributed probabilities with low (blue curve) and high (red curve) degrees of confidence look something like the curves below.


