SkiTool Usercases
What are Probability Forecasts and What Do They Mean? - slide 5
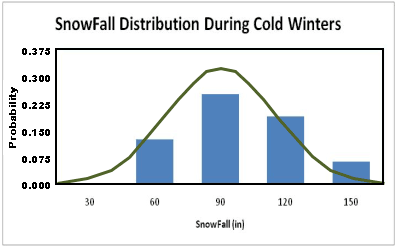
Using the observed distribution of snowfall ranges for a particular station, appropriately shaped probability curves are fitted to the data. Because many of the variables to which curves are being fit cannot have negative values, the curves are not exactly symmetrical. That is, they can have a longer tail on the right side. Thus the distributions are more closely approximated by Gamma Distributions than Normal Distributions.


