SkiTool Usercases
What are Probability Forecasts and What Do They Mean? - slide 7
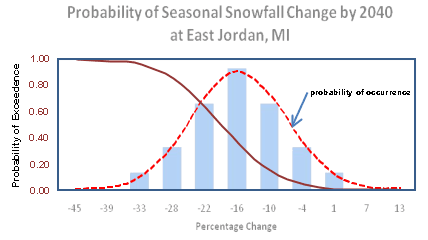
Once the actual distribution of climate scenarios is known, a smoother probability distribution curve (red) can be fitted to the GCM-based distribution. A probability of exceedence curve (purple) can then be generated. Interpretation of the results below indicates that there is only a 10% chance that snowfall decreases will be less than 4%, a 50% chance that snowfall decreases will be less than 16%, and a 90% chance that snowfall decreases will be less than 33% by 2040.